Improving Project Planning To Increase Value Of The Firm
This article was originally published on February 15, 2019 on blogspot.com
TODO: update the data and translate graphics
On February 5, Rosneft published its financial report for the year 2018, resulting in a market capitalization growth of over 4% on that day. In my humble opinion, the company has the potential for capitalization growth through the implementation of measures to reduce assets under construction (AUC).
Part 1. Measuring the quality of project planning.
A few years ago, I conducted a small study on improving the quality of capital expenditure planning. The study proposed integrating estimated data (cost, labor and material resources, physical volumes) with the construction project’s network schedule. The objective was to utilize both planned data from estimates and actual data from invoices. Additionally, specialized software was identified and tested to automate this process.
During the study, the question arose regarding how to measure the economic impact resulting from improved capital expenditure planning and which indicator should be chosen to assess the effectiveness of the implemented measures.
It is well-known that reducing assets under construction (AUC) can be achieved by:
- Enhancing the planning of capital investments and subcontracting works.
- Ensuring uninterrupted material and technical support.
- Timely development and delivery of project and estimate documentation to the contractor.
Therefore, it can be assumed that improving the quality of capital expenditure planning should lead to a reduction in AUC.
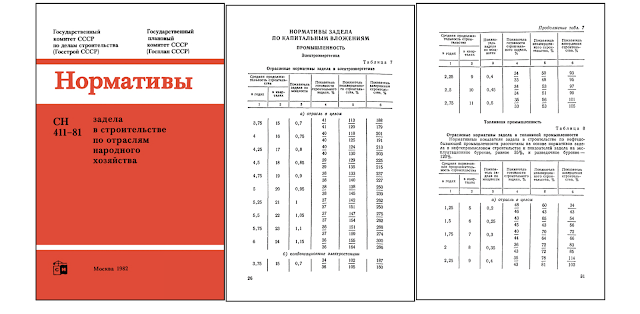
In my opinion, an appropriate indicator for this purpose could be the ratio of the volume of assets under construction to capital expenditures (AUC/CE). This measure reflects the number of rubles invested in unfinished construction works in relation to one ruble of capital investments and also characterizes the average duration of construction projects within the company. In fact, this indicator corresponds to the unfinished construction works indicator previously used in the USSR. The normative values of this indicator, depending on the industry and the duration of construction projects, are presented in VSN 411-81 “Norms of Reserves in Construction by Sectors of the National Economy.”
Part 2. Potential Reduction in the Level of AUC
To calculate the economic effect, it is necessary to determine the current and target AUC/CE ratios. While the current ratio can be easily calculated based on the available data in the reports, determining the target ratio according to SN 411-81 would require estimating the average calculated duration of construction projects. This, in turn, necessitates data on the capacities of the facilities under construction and the normative construction periods for these capacities. Due to the lack of such data, it was decided to calculate the industry average indicator based on a sample of 13 large international oil and gas companies.
The following comparisons depict the average AUC/CE values for the period 2012-2016 (Figure 1) with other oil and gas companies reporting according to IFRS standards, as well as the dynamics of these values specifically for Rosneft during the period 2009-2018 (Figure 2).

Figure 1 - Comparative analysis of the CE/FA (capital expenditures to fixed assets) and AUC/CE (average values for the period 2012-2016) indicators.

Figure 2 - Dynamics of AUC/CE in Rosneft for the period 2009-2018.
Thus, in theory, the AUC/CE ratio can be reduced to at least the industry average (median) value of 147%, and ideally, to 100%.
Part 3. Economic Impact for Shareholders.
We have to understand that inefficient (exceeding target values) volumes of AUC represent frozen financial resources that could have been temporarily uninvested or timely converted into working fixed assets.
Simultaneously, maintaining the same level of capital investments while reducing the level of AUC/CE to target levels results in a positive economic effect in the form of additional company value.
Table 1 - Company value at different AUC/CE ratios.
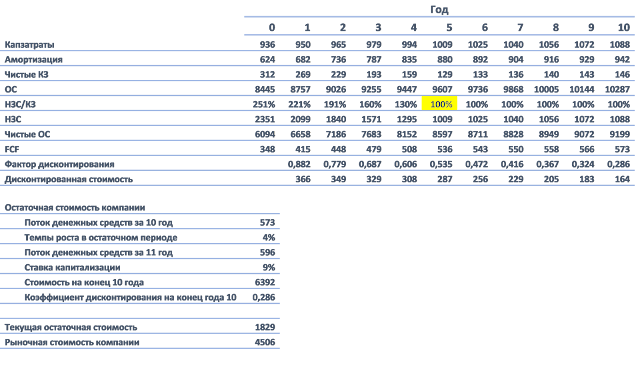
The value assessment is based on discounted cash flow calculations, assuming a reduction in the AUC/CE ratio to target values over a 5-year period while maintaining the same level of capital investments.
Table 2 - Assessment of the economic effect from reducing the AUC/CE ratio.
Table 3 - Calculation of the value at the target AUC/CE ratio (with a specified value of 100%).

It is important to note that these calculations are based on various assumptions and estimations, and the actual economic effect may vary depending on the specific circumstances and execution of the proposed measures.
The table with calculations is available at the following link.
Conclusion.
To conclude, based on the financial report published by Rosneft for the year 2018, it is evident that there is a potential for capitalization growth within the company. This potential can be realized through the implementation of measures aimed at reducing the level of assets under construction (AUC). By improving capital expenditure planning and effectively managing AUC, Rosneft can generate a positive economic impact, leading to an increase in the company’s overall value. However, it is crucial for Rosneft to carefully execute and closely monitor the proposed measures in order to fully capitalize on this potential for growth.


